
- Bone Health
- Immunology
- Hematology
- Respiratory
- Dermatology
- Diabetes
- Gastroenterology
- Neurology
- Oncology
- Ophthalmology
- Rare Disease
- Rheumatology
Contributor: The Biosimilars Wave Is Crashing on the Shores of Biopharma Development
St John Skilton, PhD, vice president of product strategy and marketing at Protein Metrics, takes a deep dive into how the development of biosimilars is evolving and how tools, such as mass spectrometry, can help companies keep up with advancing technology.


St John Skilton, PhD

And the Surfers Are Struggling to Keep Their Balance
Patent cliffs and biologics submissions are moving from being a ripple to a wave, with a few mega-waves just a few short years away. For biosimilar and biologics developers, that wave is coming faster than there are resources available to cope with them. The old ways of working will no longer sustain a pipeline, nor provide shareholder value in the same way for biopharma companies. Gone are the days when scientists could meet in person in the lab and try out experiments and write them up in paper notebooks—there just isn’t time, or the scientists are scarce, or the expertise is stretched too thin.
Why Do We Need Advanced Tech Tools?
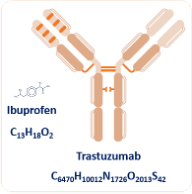
The biosimilar revolution is fundamentally different to the generics revolution more than 2 decades ago. The requirement for detailed information is huge and is commensurate with the difference in scale of molecules, and on the biochemical effects on humans. For example, ibuprofen is a tiny molecule by comparison to trastuzumab, which has almost 2000 times more carbon atoms than the decades-old painkiller. Trastuzumab is now in its second generation of biosimilars with already 421 entries as a therapy or as candidate therapies listed in Drugbank.1


Figure 1. Illustration of the complexity difference between a small molecule drug and a monoclonal antibody
Why Mass Spectrometry?
Mass spectrometry for the characterization of biotherapeutics offers some spectacular advantages:
- The level of detail available is orders of magnitude higher than with other techniques
- The ability to be almost molecule-agnostic
- It is a general-purpose analytical technique, able to adapt to different experiment types.
- Thanks to its ability to be hyphenated to several different separation techniques it can give deeper insights to single-stage analytical approaches
However, not everyone can use mass spectrometers, needing a relatively specialized skillset. Mass spectrometers are also expensive, and organizations buying them need to maximize investment. The solution to these challenges can be largely solved with the right software tools.
Automation and Data Mining Go Together
Visualizations bring a lot of clarity to humans who are not versed in rich techniques like mass spectrometry. The rise of appropriate software tools demonstrates this, but adoption has been hampered by a learning curve that steepens as molecules get larger. Tools like information exploiting dashboards, and automatic reports become increasingly valuable. Scientists now also want to query data simply (easier review) and display it in web browsers (easier sharing)—this is now a reality.
Sharing Digitally All Around the World is the New Normal
Information needs to be shared vertically in an organization from research to production, but also horizontally across geographies. Each department or location may have mass spec data that is specific to a vendor. Therefore, they also need vendor-neutral tools, or they resort to inefficient manual mechanisms for data manipulation, extraction, and sharing.
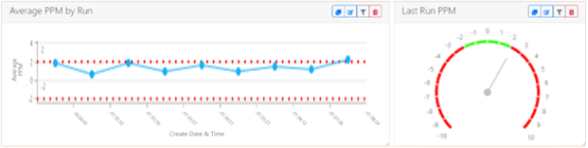
Software tools accessible and operating in web browsers are increasingly standard. This is now being applied to complex data that has information automatically derived from it. Mass spectrometry data of biotherapeutic analyses is now also in this category, despite the underlying data being utterly opaque to novice users. The displays and information layer superimposed on that is digestible by anyone. Furthermore, everyone responsible for developing a biotherapeutic can now read information in the same way across the globe. In Figure 2, for example, a lab manager can instantly see if an instrument is out of specification, without needing to look at spectra.


Figure 2. Dashboard displaying monitoring of average ppm error observed over time—used for system suitability purposes
Specialized Understanding and Molecule Specificity
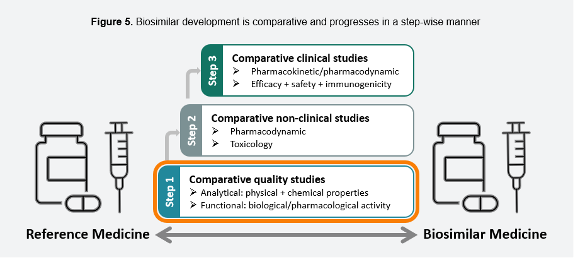
Biosimilars is a very broad term—and the European Medicines Agency ruling in interchangeability shows market and regulator progress on biosimilars has been rapid and is tightly oriented to patients.2 Already by 2004, the EMA had biosimilar regulations, and followed on with a classification of a “class” of monoclonal antibodies (mAbs) by 2015. This was not so much a scientific categorization, but a practical and market-oriented approach. It also recognized the need for first-line analytical studies, illustrated in Figure 3, reproduced from the EMA’s summary document.

; reference 2")
Figure 3. Biosimilar Development is comparative and progresses in a step-wise manner (reproduced based on original figure published by EMA)2
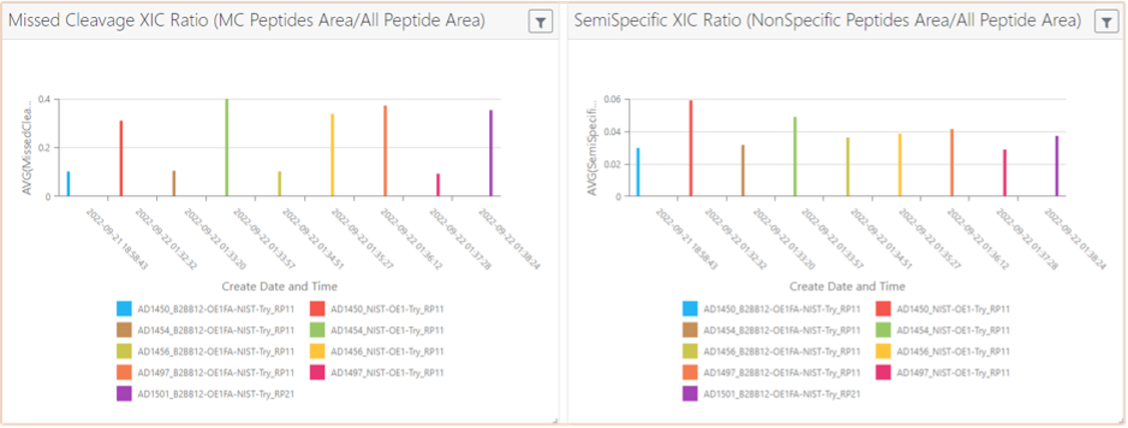
This need is satisfied by tools that can expedite the speed at which the information is processed, analyzed, and shared. Figure 4 below is a graphical display of the analysis of an IgG1 (immunoglobulin G1) mAb (peptide map) showing the efficiency of a protocol across different experiments (time-course). It is then extremely straightforward to spot outliers and act immediately if there is an issue. This type of intervention would previously have taken weeks, and biotherapeutic manufacturers simply do not have the time to waste in development as market pressure mounts, and as resources tighten.


Figure 4. Extraction of results for monitoring efficiency of peptide mapping protocol applied for an IgG1 mAb; Click to enlarge
Connectivity is Easier in the Cloud – Bring on Lab of the Future
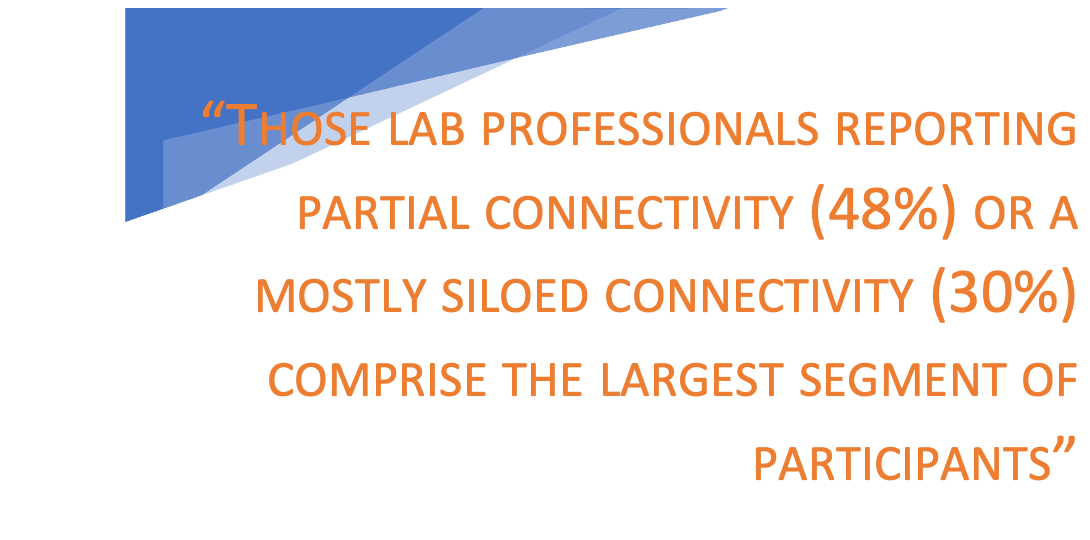
An Astrix report highlighted that many labs had started on improving connectivity, as part of their organizations’ Digital Transformation efforts, but that progress was partial. The conclusion was that the results were “consistent with what is likely a rolling implementation process based upon the prioritization of investments that can positively impact laboratory capacity, speed, and reporting of data.”3

 OR A MOSTLY SILOED CONNECTIVITY (30%) COMPRISE THE LARGEST SEGMENT OF PARTICIPANTS” Source: Astrix report; reference 4")
This rolling implementation is partly bogged down by the distance between desktop work and cloud applications. The promise of the cloud is obvious, but in reality, the implementation so far has been delivered mostly for simple data sets, small molecule applications, or data structured in standard ‘office’ products. Therein lies a trap: if you are using your experts to waste their brilliance on menial, value-less tasks such as cutting and pasting, you will be condemning your organization to a slow and unresponsive state.
By using cloud-deployed, information-rich software analysis, you significantly shorten the process of understanding what your pipeline holds.
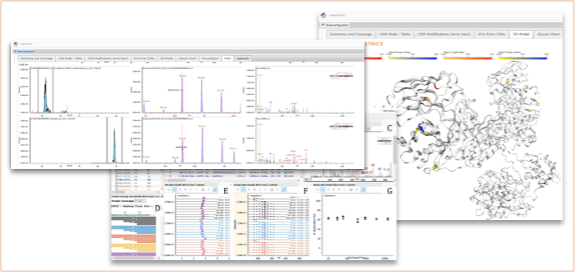
In the illustration below (Figure 5), we show a query across a set of projects, with interpretation (post-translational modification proportion), and actionable information (out of tolerance markers). Any lab manager instantly understands the stage at which their antibody has reached, and how it compares to the gold standard reference point that the regulator needs to assess. For the technical experts, the same information is available in the format they are used to, such as spectra and detailed tables. For biologists, or departments that have a different molecule overview, information can easily be rendered in 3D formats.
With the richness of information being provided to each of the stakeholders in appropriate formats, organizations are much more likely to be able to accelerate their biotherapeutic pipeline.


Figure 5. Snippets of result visualization after analytical data processing acquired for an IgG1 mAb
Complexity—An Increasing Feature of Biosimilars
Complex and heavily glycosylated molecules are also strongly represented in the upcoming biosimilar pipeline and therefore being able to rapidly analyze them is advantageous. A webinar demonstrated the easy visualization of the sialic acid content for endogenous erythropoietin (EPO) where there are already many biosimilars on the market.4 The EPO example illustrates that characterization needs will only increase, especially as antibody–drug conjugates and complex multispecifics start to appear.
More Characterization—You Are Responsible For Your Own Quality

![“[Its] been very clear that the FDA or even other regulators are not industry's quality unit”. SOURCE: STEVE LYNN, reference 7](/_next/image?url=https%3A%2F%2Fcdn.sanity.io%2Fimages%2F0vv8moc6%2Fbiosimilars%2F0928dadae166a9057c004b92ccd1df899dd91dbf-990x540.png%3Ffit%3Dcrop%26auto%3Dformat&w=2048&q=75 "“[Its] been very clear that the FDA or even other regulators are not industry's quality unit”. SOURCE: STEVE LYNN, reference 7")
Biosimilarity assessment against an innovator product will need to be part of the regulatory filing. Shortly after the approval of US biosimilar legislation in 2012, regulatory agencies made the point that the analytical burden was a much higher proportion compared to the innovator molecule. Therefore, it is important that the analytical data from tools like liquid chromatography-mass spectrometry (LC-MS) are processed efficiently and reliably, under good practice conditions. Manufacturers of biosimilars estimate that biosimilars take 5 to 9 years to get to market, and as much as a quarter of that time and money is spent on analytical work. Therefore, even a small percentage of savings means tens of millions of dollars saved.5,6 Proving compliance without added burden becomes an important stake in the ground.
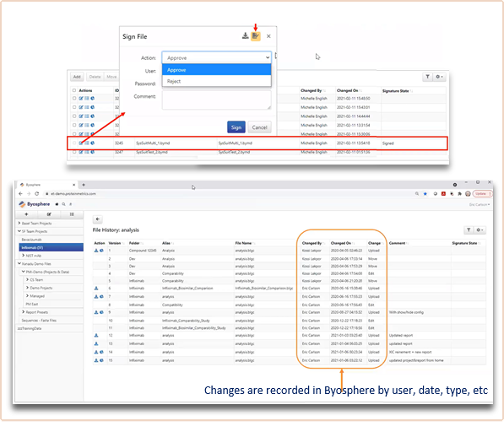
Traditionally, biotherapeutic mass spectrometry has focused on being applied for characterization, but this is changing. Therefore, appropriate tools to cope with the democratization of mass spectrometry are paramount (Figure 6). Being able to track project changes and review and sign off has now become extremely valuable.


Figure 6. Compliance-ready tools applied to track what happens with the analytical data
Key Takeaways
- Cost savings for analytical analysis can run into the tens of millions of dollars and dramatically shorten the timeline to market when data is shared as information—and with the appropriate formats.
- Non-expert analysts can get an overview of the comparability and biosimilarity in seconds and mass spectrometry can be used as a corporate wide tool beyond the hands of experts8
- In a globalized world complex mass spectrometry information must be available to anyone in an organization with permissions irrespective of their location in the globe, to facilitate decision making
- Only with better information and querying of data can data lakes be trawled for information to feed artificial intelligence and machine learning.
Author Bio
St John Skilton serves as the vice president of product strategy and marketing at Protein Metrics Inc. Skilton has experience in bringing new products to market. His experience in sales, marketing, business development, and analyst roles has helped provide a rounded view of product portfolios and how to deliver tools that are meaningful for customers.
He has been an author on many papers and with an affinity for languages has lived in the United Kingdom, France, Italy, Switzerland, Japan, the Repubilc of Korea, and South Africa. When not tinkering with the new tools that Protein Metrics provides, he plays cricket, enjoys snowboarding, does woodwork, and enjoys canoeing with his family.
References
- Trastuzumab. Drugbank Online. Accessed October 14, 2022. https://go.drugbank.com/drugs/DB00072
- Biosimilars in the EU: information guide for healthcare professionals. 2019. Updated February 10, 2019. Accessed October 14, 2022. https://www.ema.europa.eu/en/documents/leaflet/biosimilars-eu-information-guide-healthcare-professionals_en.pdf
- Progress snapshot on enabling the digital lab of the future. Astrix. June 2022. Accessed October 14, 2022. https://astrixinc.com/wp-content/uploads/2022/06/Progress-Snapshot-on-Enabling-the-Digital-Lab-of-the-Future-v4a.pdf
- EPO: separation and analysis. Protein Metrics. March 1, 2022. Accessed October 14, 2022. https://proteinmetrics.com/epo-separation-and-analysis-replay/
- The science of biosimilars. Pfizer. Accessed October 14, 2022. https://www.pfizerbiosimilars.com/biosimilars-development
- Biosimilars. Lupin. Accessed October 14, 2022. https://www.lupin.com/about-us/research-and-innovation/biosimilars-2/
- Cyntiva and BioPharm International. Regulatory requirements for safe and efficient biologic drug development. BioPharm Interational. May 10, 2021. Accessed October 14, 2022. http://www.processdevelopmentforum.com/articles/regulatory-requirements-for-safe-and-efficient-biologic-drug-development/
- Technical brief: comparability and biosimilarity assessment with protein metrics. Protein Metrics. July 2022. Accessed October 14, 2022. https://proteinmetrics.com/wp-content/uploads/2022/07/Comparability-and-Biosimilarity-Assessment-with-Protein-Metrics_revision.pdf
Newsletter
Where clinical, regulatory, and economic perspectives converge—sign up for Center for Biosimilars® emails to get expert insights on emerging treatment paradigms, biosimilar policy, and real-world outcomes that shape patient care.